Something monumental happened in baseball this past weekend—and it wasn’t the Orioles being given a nationally televised game.
By the end of play on Sunday, teams had shifted on balls in play 28,249 times, surpassing the previous record of 28,130 set in 2016. They are now on pace to shift just under 35,000 times this season, which would represent a 31 percent increase over last season’s total.
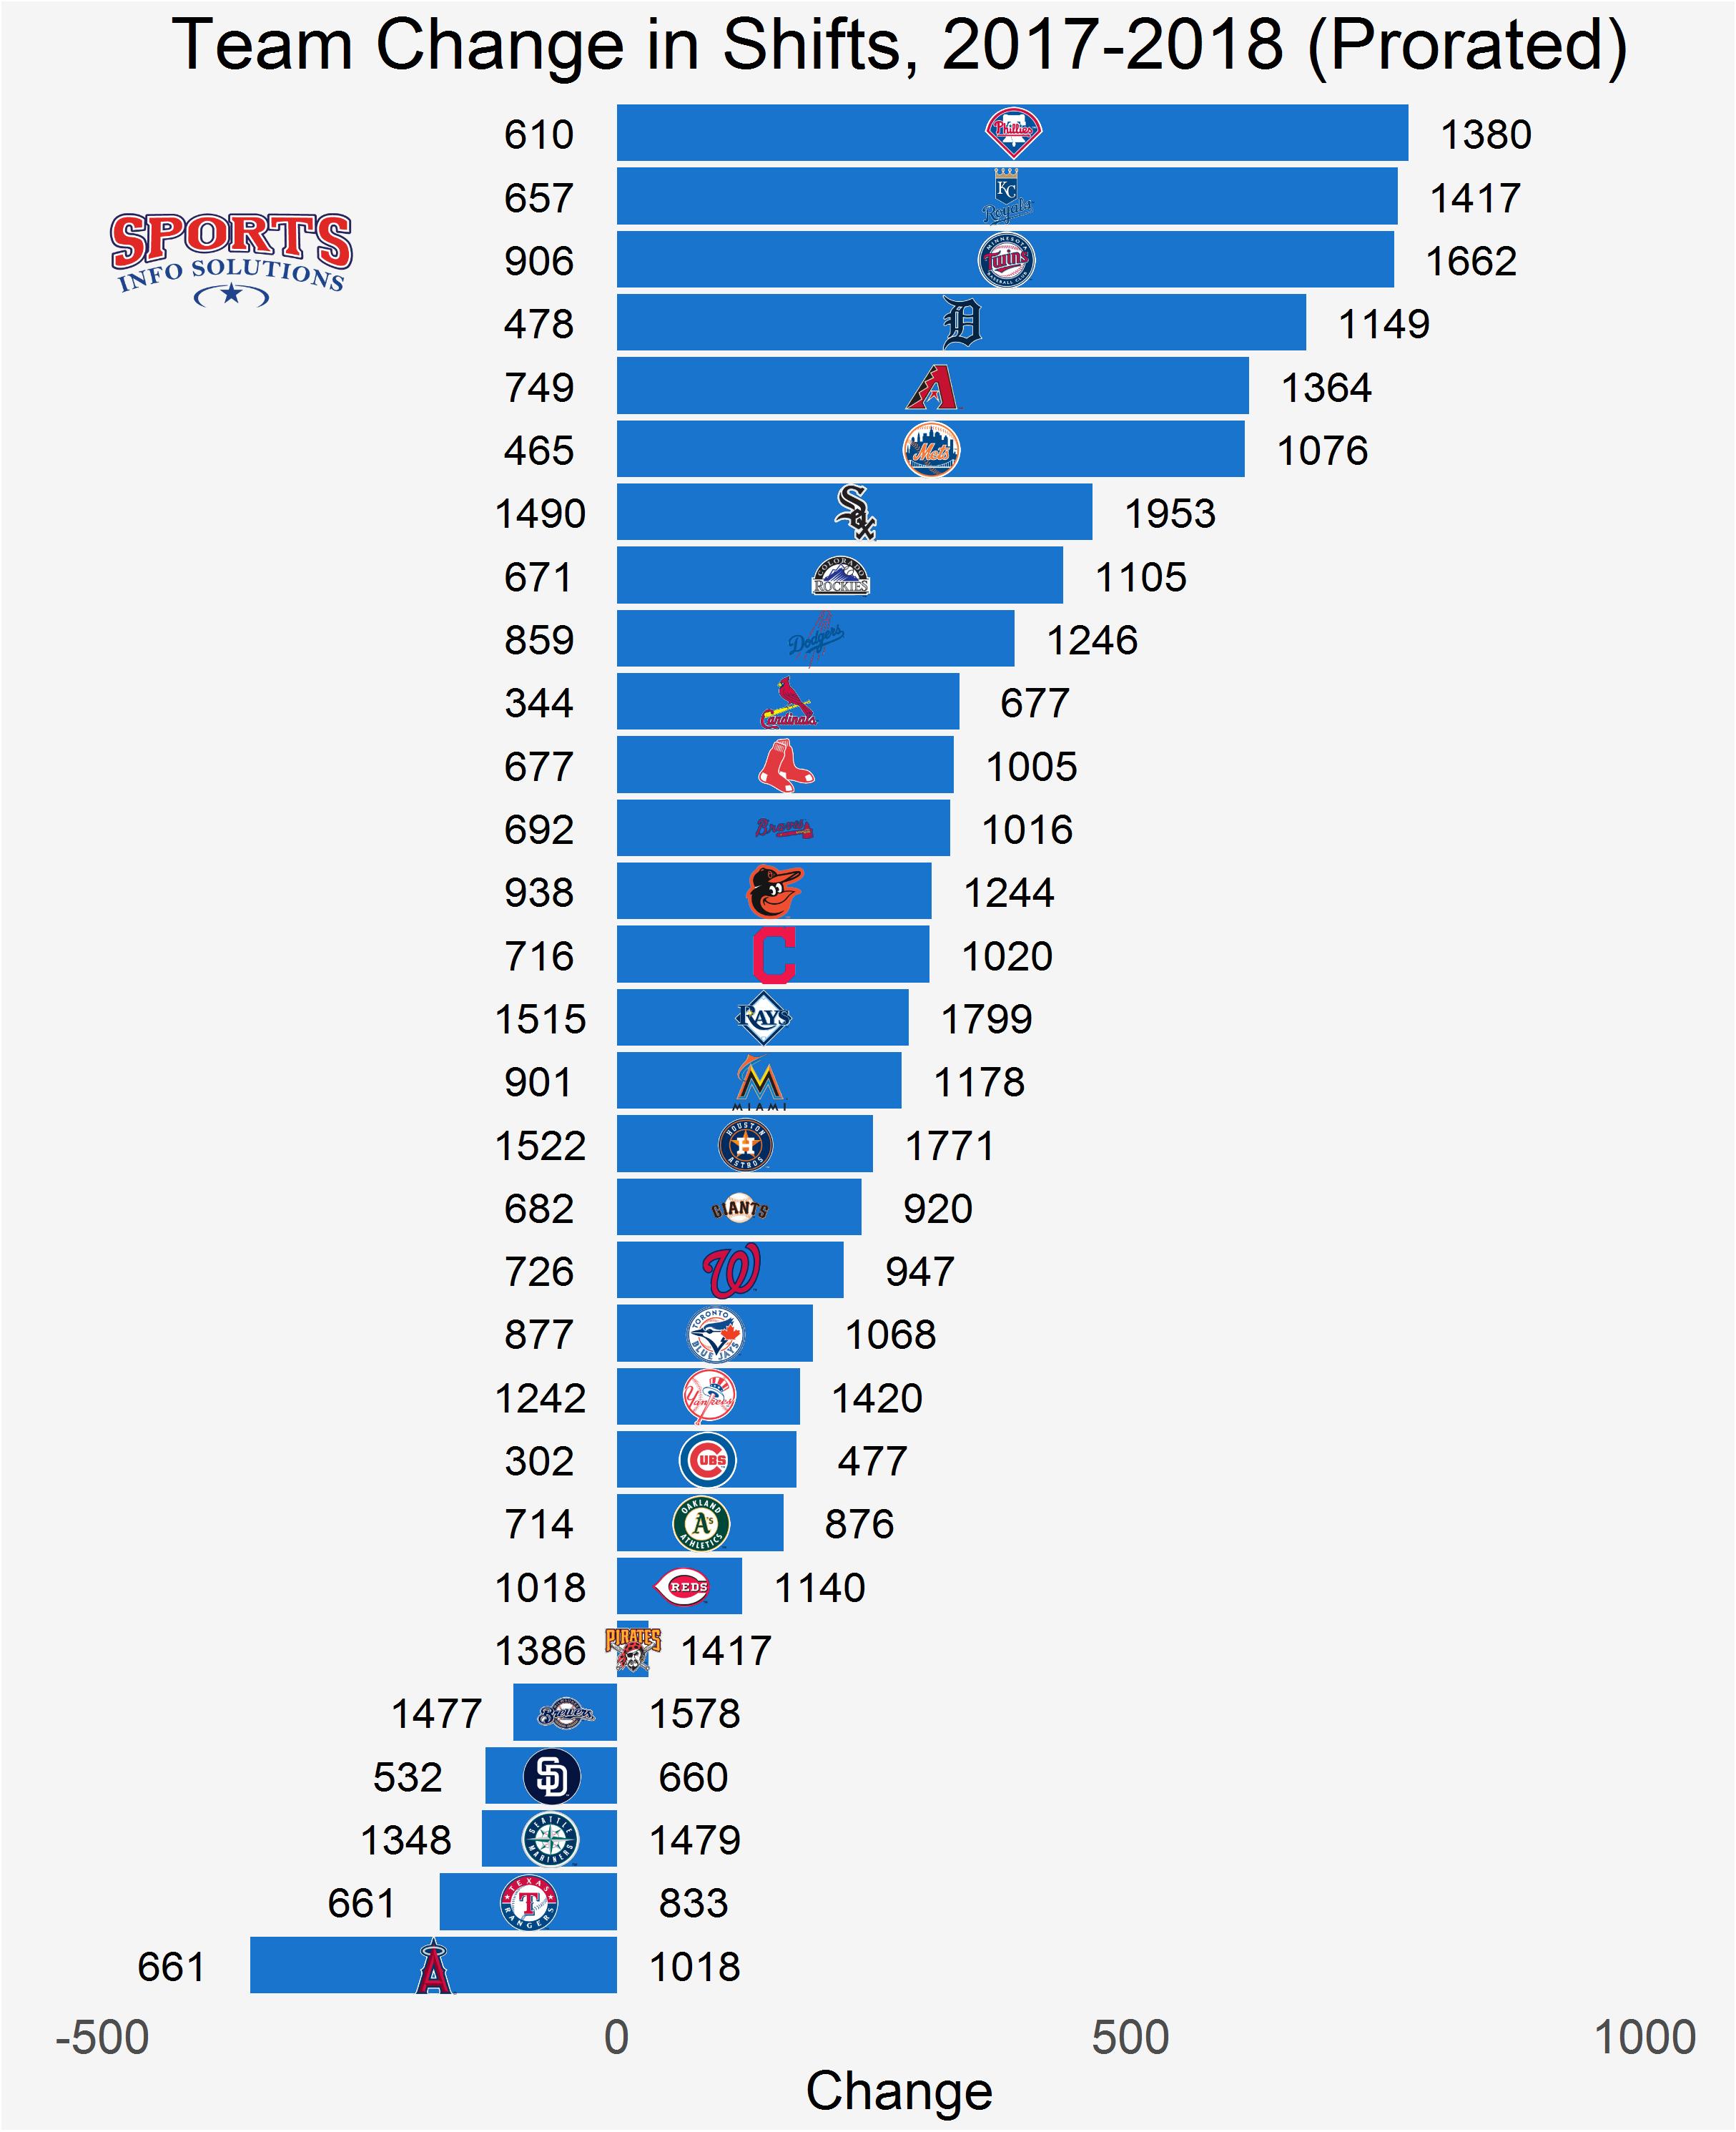
Shifts had been increasing steadily since 2009, when Sports Info Solutions first started tracking them, until declining slightly in 2017. But they now appear to be on the rise again. It’s not just one or two teams carrying the pack, either—25 of the 30 teams have increased their shift usage this season.

The Phillies have made numerous headlines this year for their proclivity toward shifting under new manager Gabe Kapler. This shows itself in the data, with no other team on pace to increase their shift usage more than the Phillies. If they continue shifting at their current rate, they will shift nearly 800 more times on balls in play in 2018 than they did in 2017.
Three AL Central teams follow right behind the Phillies in the Royals, Twins and Tigers, all on pace to increase their shift totals by more than 600. Whether those increases are related or not is hard to say, although all three teams still trail the White Sox, who shifted 1,490 times on balls in play last season and could potentially become the first team to reach the 2,000-shift mark this season.
While teams are shifting more than ever, there are still improvements that can be made. SIS’s BIS-D software provides a recommendation for every player in MLB as to whether that player is a shift candidate or not, and about one-third of shifts this season have been against players for whom the software recommends playing a standard defense. There have also been about 18,000 balls in play where the defense did not shift when the system suggested one.
How has the shift impacted the performance of those who get shifted? On the whole, the shift lowered shift candidates’ batting average on grounders and short line drives (BAGSL) by 23 points, while it had the opposite effect against all other batters, raising their BAGSL by 4 points.
Weighted* Batting Average on Groundballs and Short Line Drives, 2017-18
| BIS-D Recommendation | No Shift | Shift | Difference |
|---|---|---|---|
| Shift Candidate | .271 | .248 | Helps by 23 points |
| Non Shift Candidate | .275 | .279 | Hurts by 4 points |
*The averages are weighted such that players with extreme shift tendencies (high or low) are not over-represented, thus separating the effect of the shift from batter quality.
With shifts comprising a larger percentage of balls in play than ever before, it’s never been more important to make sure that the correct batters are being shifted.


