After a week of workouts, drills, and interviews, combine week has come to an end and NFL teams are now deep in draft evaluation. Some players have had record-setting performances, while others might have more work to do at their Pro Day to shoot their name up big boards. The data is now there for everyone to analyze, but the question is:
What do these combine numbers actually mean?
There has been a lot of discussion over the past few years as to whether or not combine results translate to a better performance on the field. Does the height, weight, arm length, hand size, 40-yard dash time, number of 225-lb. bench presses, vertical jump measurement, broad jump measurement, 20-yard shuttle run time, or 3-cone drill time of a player truly predict immediate future performance for a 1st- or 2nd-year player in the NFL?
There have been studies done in the past (here and here) in finding correlations from combine measurements to draft order, salary, and player performance. In regards to the latter, player performance was measured in total yards, yards in rates, and quarterback rating.
At SIS, we can use our Total Points metric as the proxy to player performance to find correlations to combine measurements. For the purpose of this article, combine data from players who participated between 2016-2020 was collected and compared to the respective player’s first two-year Total Points sum. Correlations were computed between both Total Points and categorical Total Points (ex. Passing Total Points) based on positions to find any signal for a specific skill.
Without any further ado, let’s dive into the numbers…
Quarterbacks
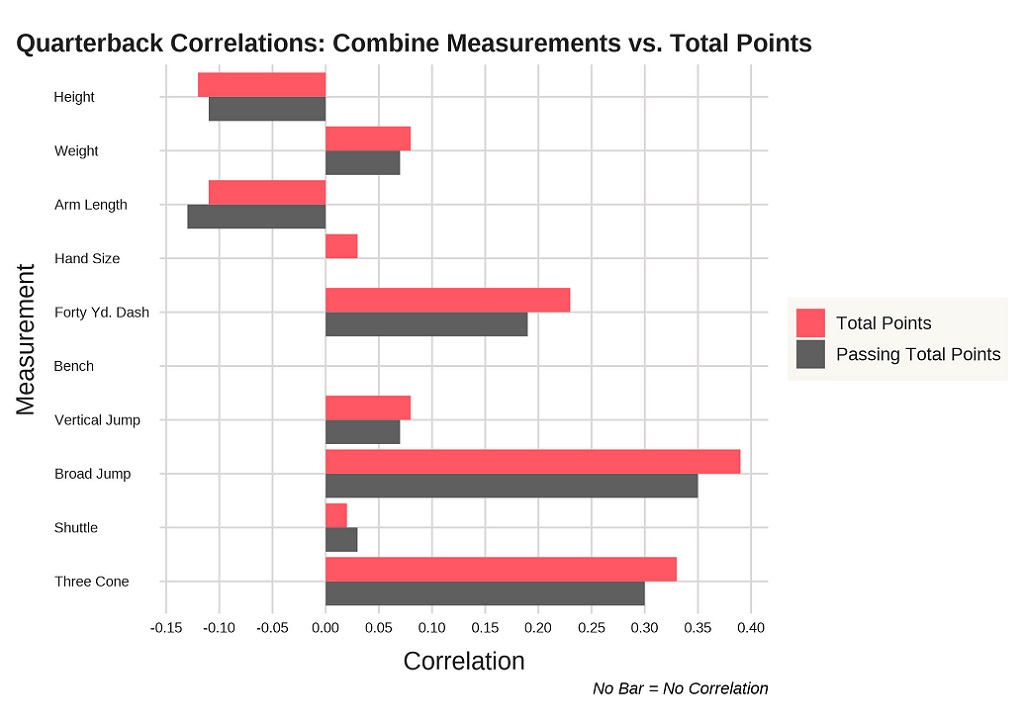
When it comes to quarterbacks, it is not a big surprise that Total Points and Passing Total Points are very similar. The main skill the quarterback has to perform is throwing the football, so seeing that these two align for most measurements make sense.
Three measurements that stand out from the rest in terms of correlating to Total Points. The broad jump takes the cake as the highest correlated at 0.39 (0.35 Pasing Total Points), followed by the three cone drill at 0.33 (faster times lead to more Total Points) and the 40-yard dash at 0.23.
Contradicting some of the discourse about quarterback hand-size, this measurement has a 0 correlation to Passer Points. Turns out Kenny Pickett might have a chance after all!
Running Backs
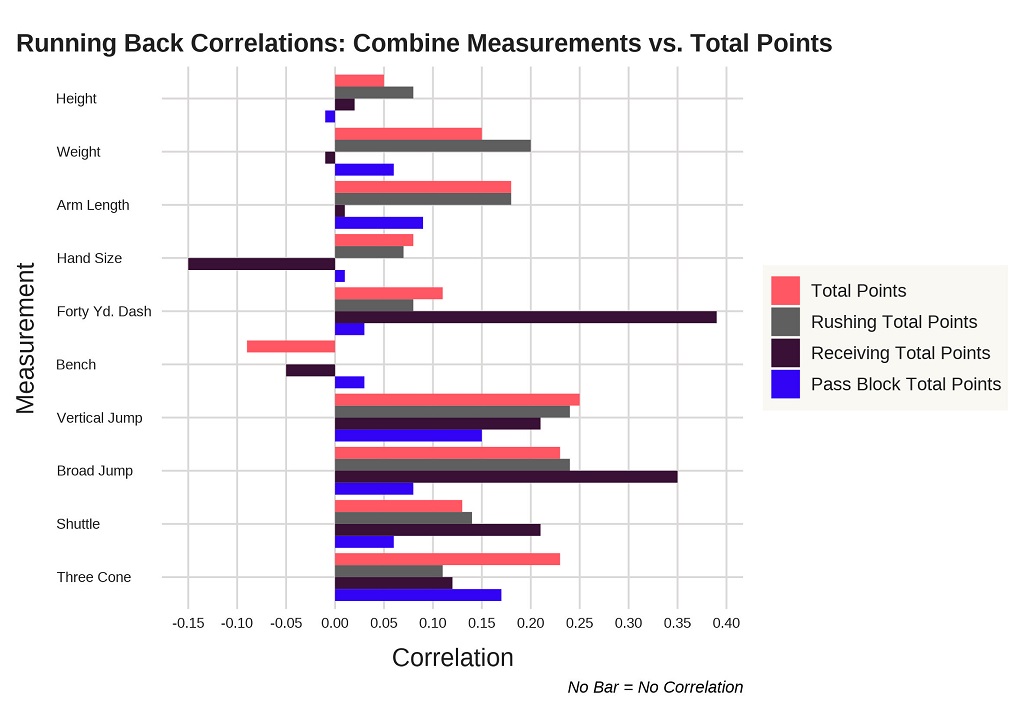
When looking strictly at Rushing Total Points, there are three measurements that clear the 0.2 correlation threshold. Weight, vertical jump, and broad jump measurements correlate the most to Rushing Total Points.
This suggests that explosiveness and leg strength translate well to the next level and can be a potential indicator of running back performance. Across the board, being bigger and faster correlates with success.
When it comes to Receiving Total Points, the 40-yard dash and the broad jump correlate the most by far. This suggests that the ‘explosive pass-catcher out of the backfield’ moniker truly does exist.
Looking at Pass Block Total Points for running backs, the three cone drill and vertical jump seem to predict some success at the next level.
Wide Receiver
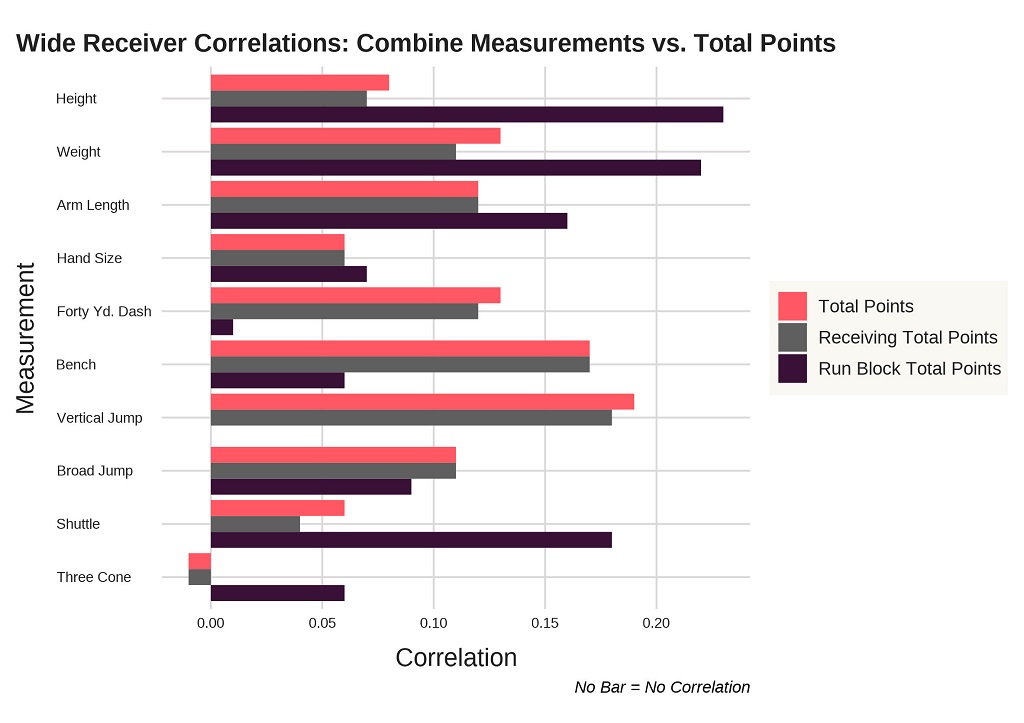
The vertical jump and bench reps stand out as the two highest correlated measurements to Receiving Total Points. Even though the average Run Blocking Total Points value among receivers is small, height, weight, arm length, and the shuttle run correlate the most out of these measurements when projecting success.
No measurements for Receiving Total Points reach the 0.2 threshold. One point to note is that pass blocking correlations in height and weight for receivers are much higher than those for the running backs.
Offensive Linemen
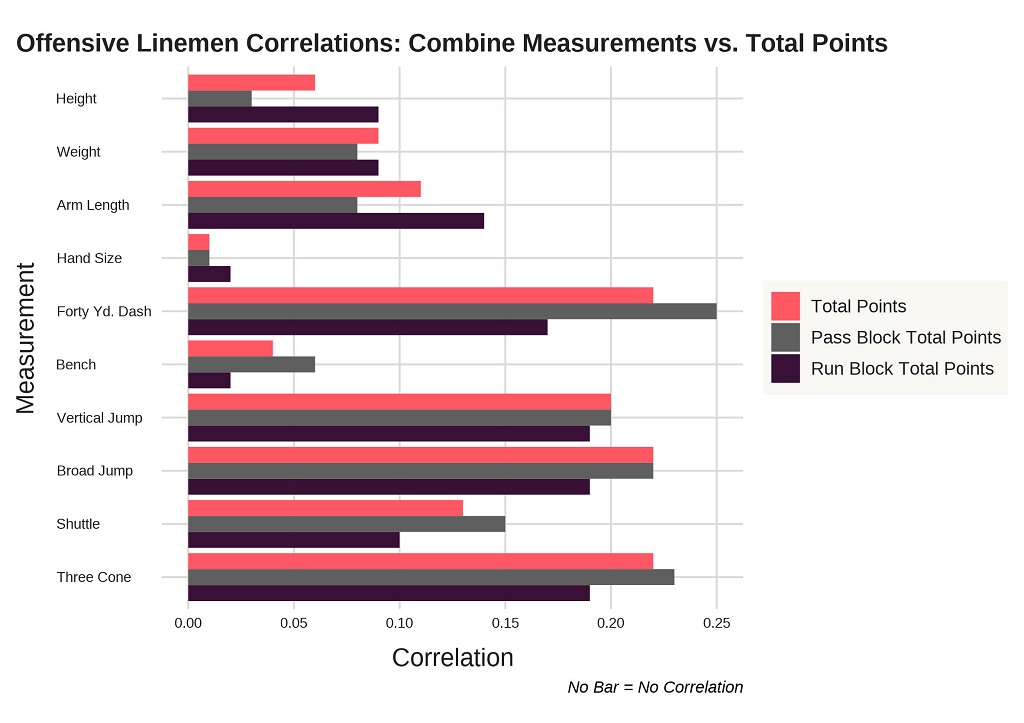
Pass Blocking and Run Blocking Total Points correlations for offensive linemen are similar for each measurement, with the 40-yard dash, arm length, and height having some difference between the two. Surprisingly, height and arm length seem to correlate more with run blocking than pass blocking.
Overall, the 40-yard dash, three cone drill, vertical jump, and broad jump are the highest correlations when it comes to offensive line play. Bench reps have a low correlation, once again showing that leg strength and explosiveness predict higher success.
Tight Ends
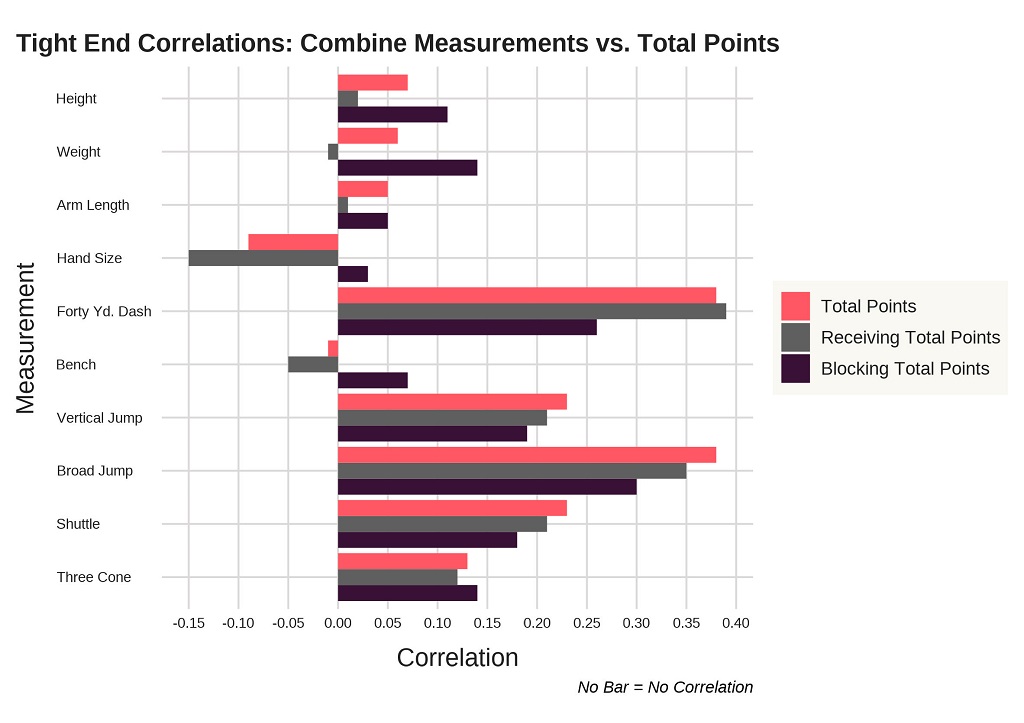
For tight ends, the 40-yard dash and the broad jump have high correlations to Total Points, as they both nearly reach the 0.4 correlation threshold. The vertical jump does not fall that far behind either.
The difference in broad jump, shuttle times, and three cone times between tight ends and receivers in Receiving Total Points is interesting. The get-off speed for a tight end might result in higher Total Points, which can be measured in explosiveness from the legs.
Defensive Linemen
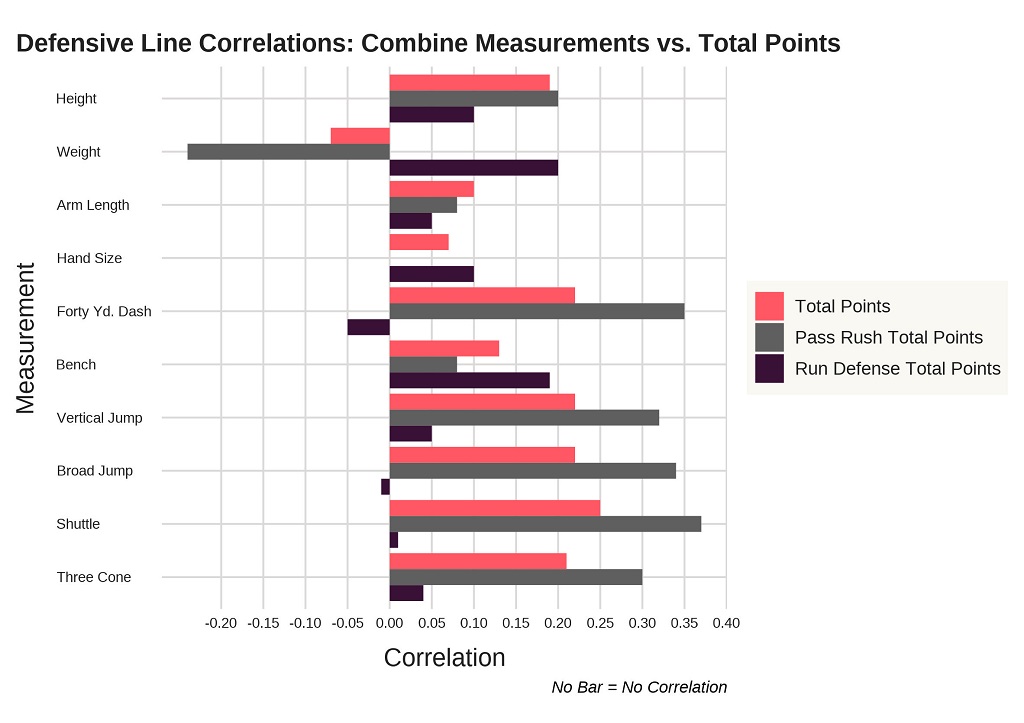
Moving along to defense, we start with the defensive line. All of the speed measurements, height, weight, vertical jump, and broad jump correlate well to Pass Rush Total Points. This is very different when compared to Run Defense Total Points, as the higher the weight and more bench reps, the higher the Total Points value.
All in all, an athletic freak on the defensive line when getting to the passer seems to be a good thing to have. On run defense, a strongly built defensive linemen is the key for success. The contrast between these two skill sets in one position group is the biggest from this analysis.
Linebackers
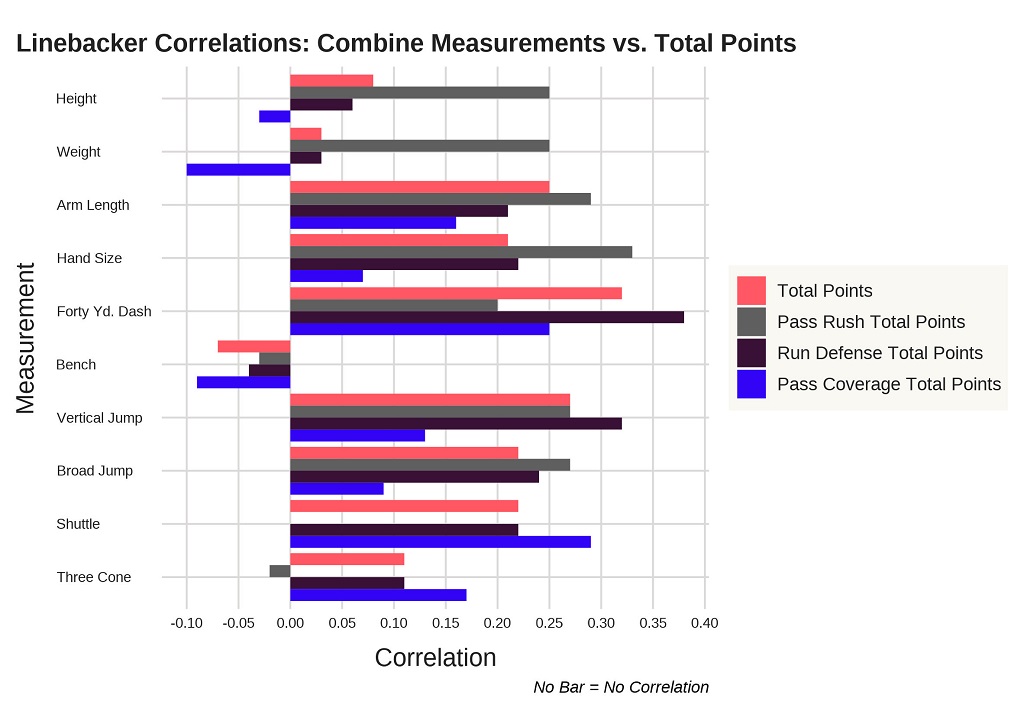
Once again, for the linebacker position, athletic freaks tend to have the most success. All but 3 measurements reach the 0.2 correlation threshold for Pass Rush Total Points. After being significant for defensive linemen, the shuttle run and three cone times correlate to 0 and below, respectively, for linebackers. From a run defense perspective, the vertical jump and 40-yard dash times show the strongest correlations. Finally, both the 40-yard dash and shuttle runs are where the highest correlations are for linebacker pass coverage.
Defensive Backs
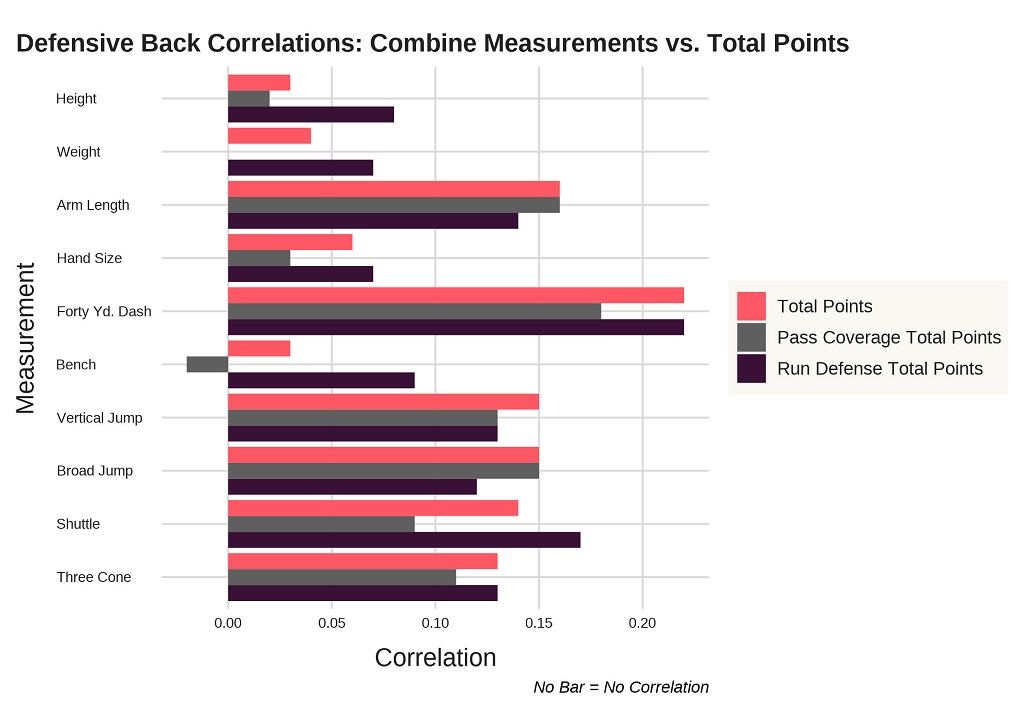
There are no correlations for Pass Coverage Total Points that reach the 0.2 threshold for defensive backs. The 40-yard dash and arm length are the two highest correlations for Pass Coverage Total Points. On run defense, only the 40-yard dash reached the 0.2 threshold.
Conclusion
Overall, there are no correlations that exceed the 0.4 threshold across any position, measurement, and Total Points category. This is consistent with the previous studies that suggest there is no strong correlation between measurements and skill sets.
Two measurements that seem to find themselves at the top of most positions were the vertical jump and broad jump.
A strong and explosive lower body tends to predict more success, generally speaking, when looking at Total Points. On defense, speed is the key, as 40-yard dash, three cone, and shuttle times were some of the highest correlated measurements for all 3 defensive skills.
All in all, don’t be fooled by the insane numbers seen at the combine. Yes, some are more meaningful than others, but there is a lot more that factors into having success in the NFL.


