In the past five years or so, expectation-based metrics have gained traction in the football space as a way to standardize performance across different contexts. An even more recent development is the fixation on anticipation which has largely emerged as a way to sensationalize pedestrian quarterback play under favorable conditions (Tua Tagovailoa’s quick releases come to mind).
Expected Snap to Throw +/- (xSTT+/-) fits neatly into this intersection, and I’d like to use it to reframe how we think about dropback outcomes.
Some passing plays take longer to develop than others. A quick-game concept like double slants-stick develops faster than a play action shot play – at least in theory. And xSTT+/- takes factors like shotgun, drop depth and play action to roughly approximate when the ball should come out, and then compares this baseline to the actual snap to throw time on a play.
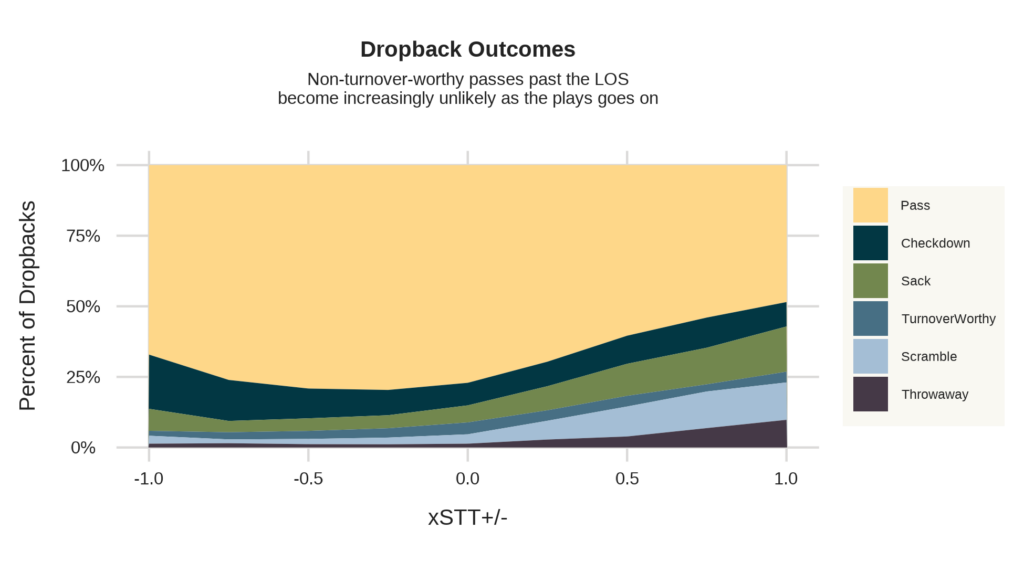
But, once the quarterback crosses the threshold of when the ball is supposed to be thrown, negative outcomes become more likely as the play unfolds. As the structure disintegrates into good, old-fashioned, backyard football, rushers come unblocked, the pocket collapses, and receivers begin to improvise their routes. This seems fairly intuitive and is borne out in the data:

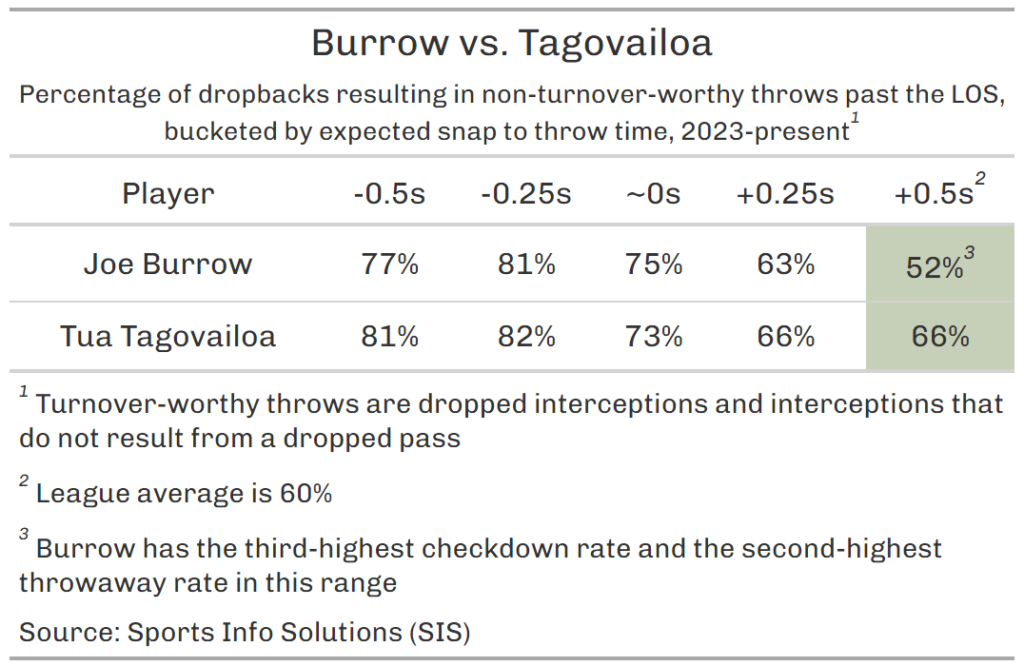
What is more interesting is what’s occurring within these buckets on a player level. On the front end, when the play still resembles ‘how it’s drawn up,’ quarterbacks do not deviate too much from each other in terms of the rate at which they throw the ball downfield (as outlined in the graph above). Within a quarter of a second – which is a long time in the NFL – on either side of the expected snap to throw time, the middle 80 percent of players (i.e. non-outliers) only deviate from average by about five percent, give or take.
And this speaks to the level of automation NFL quarterbacks have trained towards: in neutral conditions, they all consistently perform the same general task (throwing the ball downfield without putting it in harm’s way).
But, things start to get really weird at a half second beyond the expected snap to throw time. This is when the clock strikes midnight, where deviations ranging from -15% to +25% can be seen even after removing these outliers. And this is where players really begin to differentiate themselves from one another. Let us examine some of these profiles further.
A ready-made comparison is Joe Burrow and Tua Tagovailoa, who will forever be linked to each other as the first two quarterbacks selected in the 2020 NFL Draft. These are players who throw downfield at pretty similar rates, until the tipping point of 0.5 xSTT+/- is reached:

Burrow and Tua diverge sharply once we hit the twilight zone, with Burrow suddenly becoming extremely gunshy. On the one hand, Tua is ‘putting the ball into play’ more often than his counterpart; on the other, Burrow has not made a turnover-worthy throw in this range and Tua has a 5% turnover-worthy throw rate.
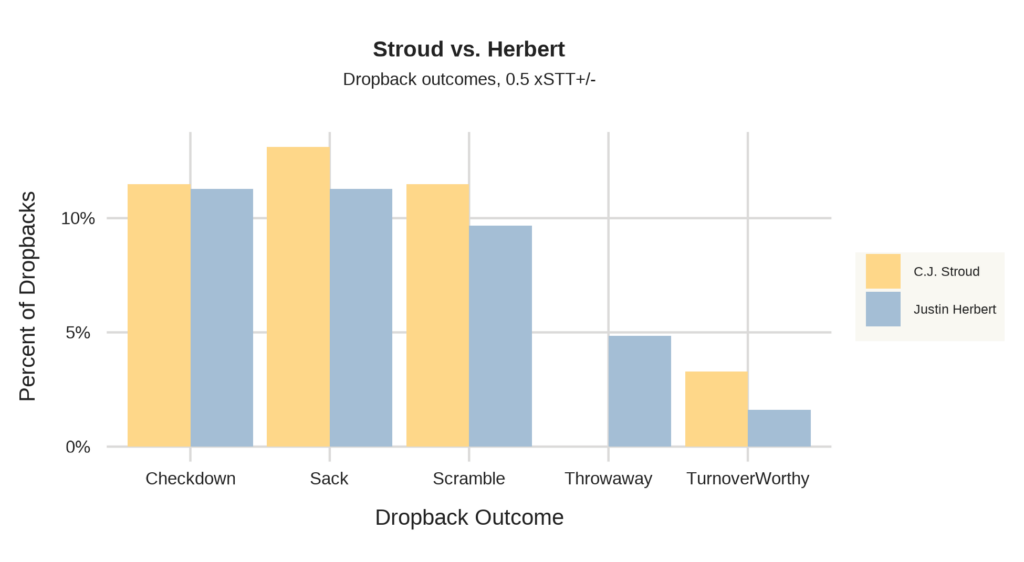
This is not the only way players differentiate themselves later in downs. Take, for example, Justin Herbert and CJ Stroud, two players who are very close in terms of the rate at which they make non-turnover-worthy attempts downfield in this 0.5s xSTT+/- range. Outside of that, the composition of other outcomes is different, with Herbert scrambling less frequently, taking fewer sacks, and putting the ball in harm’s way less often, largely as a result of throwing the ball away more:

Herbert averages 0.09 Total Points/dropback here, as opposed to Stroud’s -0.2 Total Points/dropback, largely as a consequence of avoiding bad plays more frequently.
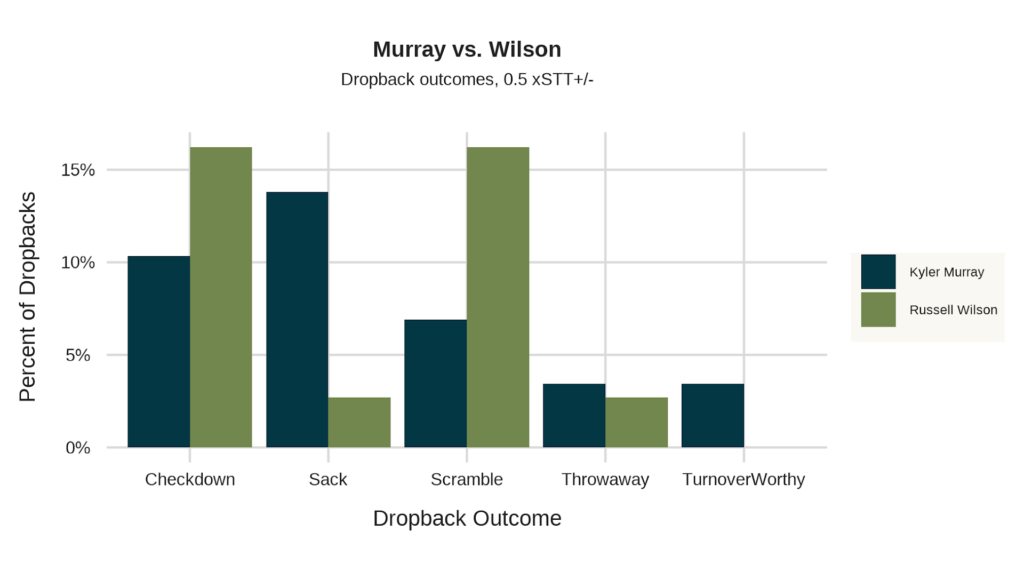
We can also observe this phenomenon in quarterbacks who are considered to be scramblers. Kyler Murray and Russell Wilson both throw the ball downfield at nearly identical rates but behave rather differently otherwise. Murray tends to hold out hope for the big play (and takes a lot of sacks), whereas the aging Wilson simply opts for checkdowns and scrambles:

It should not be surprising, then, that Murray’s Total Points/Play of -0.05 here is much lower than Russ’s (0.33). That puts Wilson among the best in the NFL late in the play, while Murray is in the bottom half of the league.
Ultimately, we’re still talking about a relatively small sample of plays and, therefore, this is subject to variance. These plays could perhaps be bucketed on a more empirical basis – the quarter-second buckets are admittedly a bit arbitrary – in a future study this offseason. There is also an opportunity to examine within-player trends: how behavior at one point in time relates to behavior earlier or later in the play.
Furthermore, attempting to control for external variables, like pressures, is likely needed for a more conclusive affirmation of the preliminary findings outlined here. A play with average snap to throw time when there was early pressure might be similar to a late throw with no pressure, for example. Lastly, it might be prudent to take a more longitudinal approach in future studies.
With few exceptions, quarterbacks in the NFL are too good to be allowed to play under optimal conditions on a down-to-down basis. Efficiency under pressure is crucial, but also has been shown in the past to be noisy. That said, football analytics has come a long way in a short time, and the notion that players can be good or bad under pressure – or even that their behavior under such conditions is somewhat predictable – should be periodically reexamined with newly developed metrics such as xSTT+/-.


